
Descriptive statistics: describe the data.
Summarize (statistics), tabulate (frequency distribution), graph (histogram, etc.)
| Data | ||||||
|---|---|---|---|---|---|---|
| Qualitative (nominal, categorical)
words | Quantitative
numbers. | |||||
| ||||||
Levels of measurement
| Level | Examples | What can do with | |
|---|---|---|---|
| Nominal | names, labels, categories |
Yes/No, Agree/Disagree, Have/Havenot, Success/Failure, M/F, ...
MaritalStatus, State, County, Zipcode, Major, Brand,make,model,color, Place race,religion,party,ideology..., TaxFilingStatus, Blood type, Housing type, Pet | Count/tally each category. Relative frequency. Mode. Bar chart.
Chi-square Tests (independence, goodness-of-fit) Confidence interval 1-PropZInt |
| Ordinal | orderable/rankable categories
but differences (obtained by subtraction) between data values either cannot be determined or are meaningless. | class(frosh/soph/jun/sen), trim levels, film ratings,
gold/silver/bronze, letter grades, days of week, months, Education level,
clothing sizes, pain scales, military rank, star ratings, priority/risk levels
Percentiles. Likert scale: Strongly disagree / Disagree / Neutral / Agree / Strongly agree Very dissatisfied / Dissatisfied / Neutral / Satisfied / Very satisfied Poor / Fair / Good / Very good / Excellent | Above + median/quartiles, Spearman. |
| Interval | Numbers: orderable, and differences between data values can be found and are meaningful. But no natural zero (meaning none of the quantity). | Temperature C or F, Years/Dates, shoe size, IQ/SAT, FICO, pH, BMI
0 is fakish | histogram, mean, median, SD...
Estimation, CI: t-test, Hypothesis testing, ANOVA, correlation, linear regression |
| Ratio | Numbers: orderable, and differences between data values can be found and are meaningful, and natural zero (meaning none of the quantity), and ratios (eg. "twice as much") are meanginful. | Weight Height Age Length Area Volume Time Money TemperatureK Energy BP LDL MPG MPH BPM DJI S&P500 counts | Above + CV, GM, |
Measurements have some measuring unit, e.g. inches, pounds, meters, minutes, acres, grams, MPH, BPM, ng/L, ... but they are basically irrelevant for the statistical work.
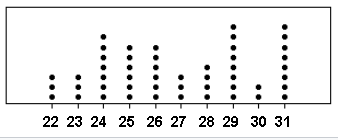
Some Triola data
Some data distros
Example: Population: weights of adults in country/county.
Not possible to census this. So need a non-biased, representative sample (a teaspoon of the pot of soup).
Ideal: Simple random sample (SRS): every adult equally-likely to be in the sample
and every sample of that size is equally-likely.
The selection procedure/method to take the sample is the "random". Randomly-taken sample.
Bad: voluntary response, convenience sample.
Collect data. Measured vs self-reported (unreliable).
Calculate/derive statistic from the data: a point estimate of the parameter.
But samples have uncertainty/variability so determine [confidence] interval estimate.
Inferential statistics: use probability to understand/quantify/describe uncertainty.
If have census, i.e. population is all known, no need to sample, just describe the population.
Sample(s) only useful/taken/needed to estimate population parameter(s).
Very Strong / Textbook Examples of Normal Data

Human heights (adult men or women within one population group)
Adult male heights in the US: mean ~175 cm, SD ~7 cm
Adult female heights: mean ~162 cm, SD ~6–7 cm
Very close to normal when measured in large samples from a single ethnic/geographic group.

IQ scores (standardized tests like WAIS, Stanford-Binet)
Designed to be normally distributed: mean = 100, SD = 15 (by construction).
One of the purest real-world normal distributions.

Birth weights (full-term infants in a population)
Mean ~3.4 kg, SD ~0.5 kg
Very close to normal for healthy, full-term babies.

Measurement errors (in repeated measurements of the same object)
Length of a metal rod measured 50 times with a caliper
Errors due to small random fluctuations → almost perfectly normal.

Blood pressure (systolic or diastolic in a healthy adult population)
Systolic BP in adults: often close to normal (mean ~120 mmHg, SD ~15–20 mmHg) when excluding hypertension cases.


Examples That Are Approximately Normal (Good Enough in Practice)

Test scores on standardized exams (SAT, ACT, GRE, etc.)
Scores are deliberately scaled to be roughly normal (mean 500–1000 range, SD ~100–200 depending on test).

Body mass index (BMI) in large adult populations
When excluding extremes (severe obesity or underweight), BMI often looks roughly normal.

Reaction times (simple visual or auditory reaction time tasks)
In controlled lab settings, reaction times are close to normal after removing outliers.

Residuals in regression models
In linear regression, the residuals (errors) are often assumed and observed to be normally distributed when the model fits well.
Right-skewed data:
Income / wealth distributions
Time to failure of mechanical parts (exponential)
Time between customer arrivals (exponential inter-arrival)
Insurance claim sizes
Sizes of cities / populations
Sizes of earthquakes (Richter scale)
Sizes of forest fires / natural disasters
Number of children per family
Time spent on websites / app sessions
Number of social media followers / likes
Sizes of companies (employees, revenue)
Word lengths in texts
Sizes of file downloads / internet traffic
Bacterial colony counts
Particle sizes in aerosols or sediments
Waiting times in queues
Data in Text file (.txt, .dat) or webpage, in column (of many columns, each a different data set):
Open it or Import it in Excel. Select column, copy, then paste into other SW.
OR
Open it in Notepad and then select all (Ctrl-A) then copy (Ctrl-C) and paste into Excel.
Select column, copy, then paste into other SW.
BodyTemperatures.txt
Stem-and-leaf plot.
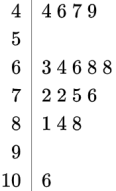
Data: 44 46 47 49 63 64 66 68 68 72 72 75 76 81 84 88 106
computer PRNG (pseudo-random number generator) : 9 quadrillion of them (@1/s → 285M years)
Each pixel randomly black or white:
 Sound track of randomness: