Examples of linear functions
Temperature conversions between Celsius and Fahrenheit.
From a high near boiling point of water to a low of Antarctic winter.
Their common point is -40 (-40F=-40C, the only degree where F and C are the same number).
The graph is doing double duty: when converting from C to F,
C is on the x axis, F the y.
when converting from F to C,
F is on the x axis, C the y.
These functions are inverses of each other; they intersect at (-40,-40).

Sum of two real numbers is S
Infinite number of combinations of two real numbers that sum to a given number.

MPG
Different miles per gallon mileages.
X axis is gallons, Y axis is miles.
Y axis is on different scale, thus the appearance of the lines does not represent
the actual value of the slopes. A line of slope 1 here would barely be off the X axis.
As is often the case in real situations, the negative values of x and y
(i.e. gallons and miles) don't have meaning in the real world and so
are removed from the graph.

Wages
Each function is a different payrate. The slope is the hourly wage in $.
Each point on the line represents the total wages earned for the amount of time.

d=rt
distance = rate * time
Each function is a different rate. The slope is the rate.
Each point on the line represents the distance traveled at that of time
(or after that much time). Constant speed (velocity), means no acceleration.

Currency exchange.
Pretend there are four imaginary currencies: A, B, C, and D.
Pretend the $ is worth 100 D's, 20 C's, 1B, and 1/2 A.
This graph shows how much every amount of $ from 0 to 100 is worth in the other currencies.
The black line is the function with slope 1.

Weight of a substance (solid or liquid)
Given a volume amount of the stuff,
multiply by the density of the stuff to get the weight (mass) of it.
Density is the slope.

The gram is defined as the weight (mass) of 1 mL (cc) of pure water.
Thus water's density is 1 g/mL.
Linear Growth
Starting with 100 (which can be thought of as 100%, all we have, 1, the whole),
shows what it grows to with different growth rates. X-axis could be time (in whatever units),
money, work, energy etc. For each x unit, the y increases by the same constant value for
each of the different growth lines (i.e. the increase in y is the same for each x unit).
The slope represents the amount of growth per x increase.
Y value 200 represents a doubling of the original amount.

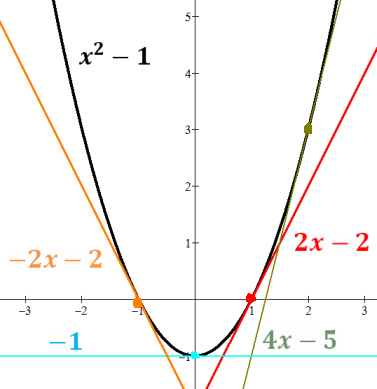
Tangent line at a point on a curve.
The first derivative of the curve's function evaluated
at the point (i.e. with the point's x coordinate)
tells the slope of the tangent line: ƒ'(x)=m.
Using the given point(x,ƒ(x)) and the slope m in the
point-slope formula y-y1=m(x-x1) yields
y = ƒ'(x1)x + y1-ƒ'(x1)x1
as the slope-intersect form of the line tangent to the curve at the point
(x1,y1)