| Population | Sample | Sample mean (SEM=σ/√n) |
|---|---|---|
| z = (x - μ) / σ | z = (x - x̄) / s | z = (x̄ - μ) / SEM |
| A data set: | its Z scores: | |
|---|---|---|
|
|
|
| N = 100M | |||
|---|---|---|---|
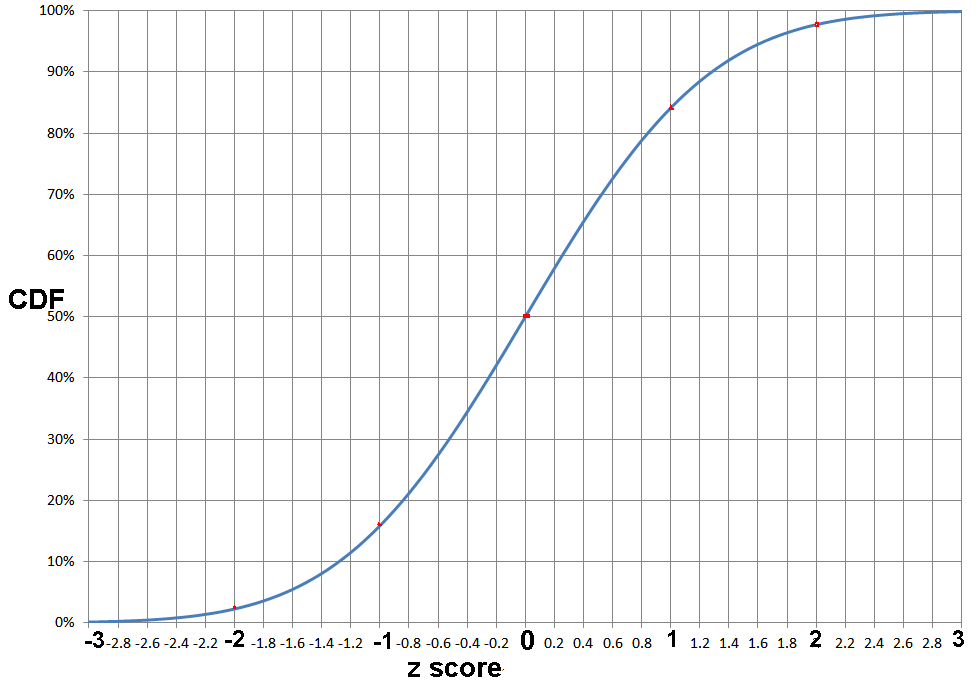
| ≤μ .5 | ≥μ 50% | ½ | 50M |
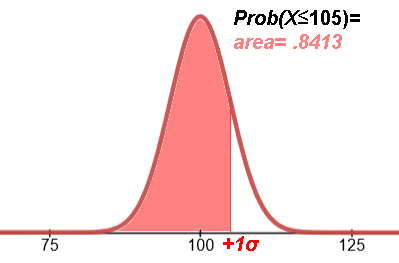
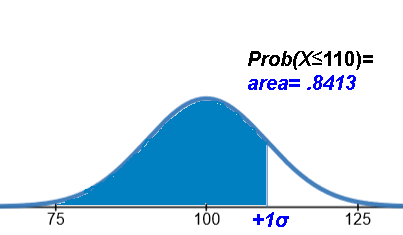
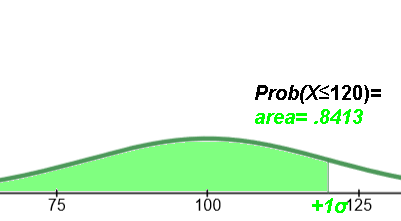
| ≤μ+σ .8413 | ≥μ+σ 15.87% | 1/6.3 | 15,870,000 |
| ≤μ+2σ .9772 | ≥μ+2σ 2.28% | 1/44 | 2,280,000 |
| ≤μ+3σ .9987 | ≥μ+3σ .13% | 1/769 | 130,000 |
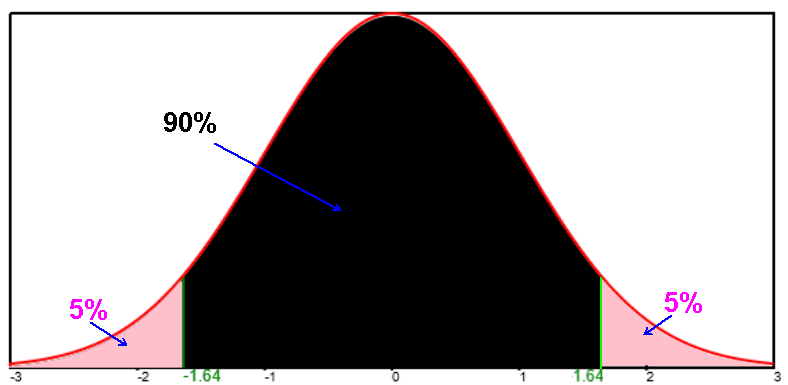
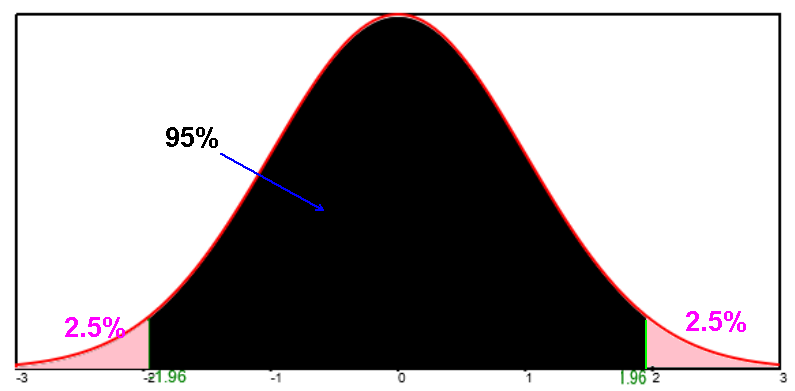
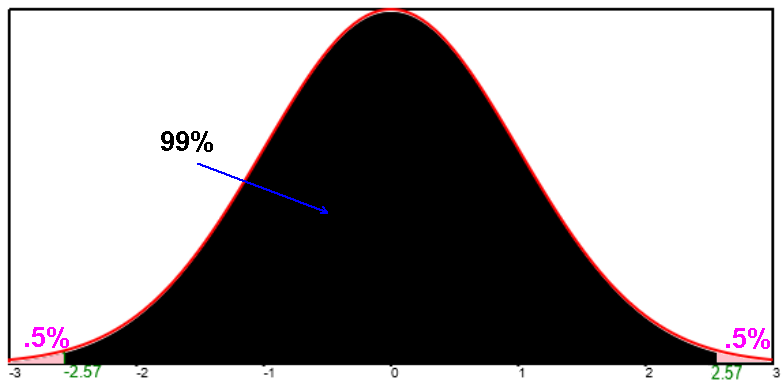
Critical values: zc= 1.645 for 90, 1.96 for 95%, 2.326 for 98%, 2.576 for 99%
Quartiles and deciles of the standard normal distribution.
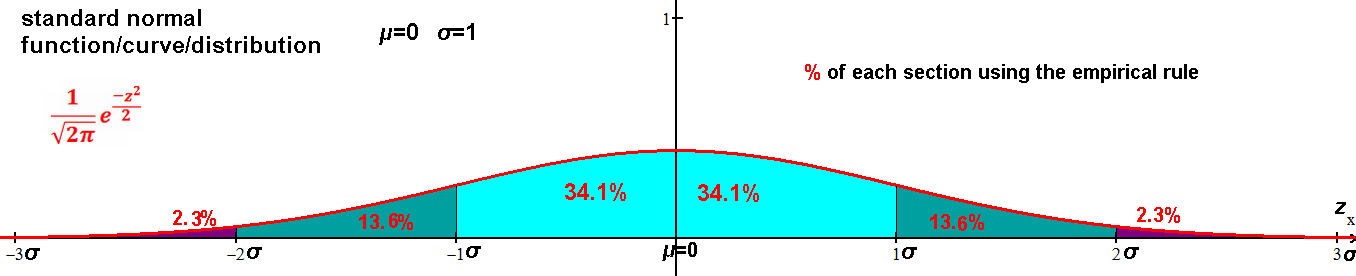
All normal curves: area under the curve equals 1.
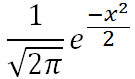
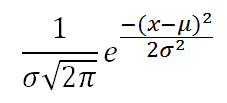
Function of x (or z):
 equivalently:
Mathpapa:
y=1/(sqrt(2*PI)) * e^(-x^2/2)
Desmos:
y=1/(\sqrt{2\cdot\pi})\cdot e^{(-x^{2}/2)}
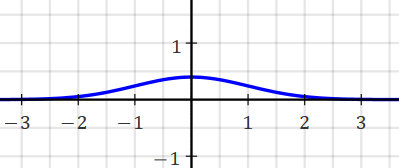
(vertical exaggerated to see the "bell"):
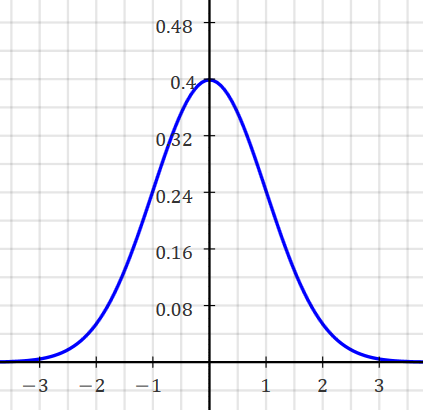
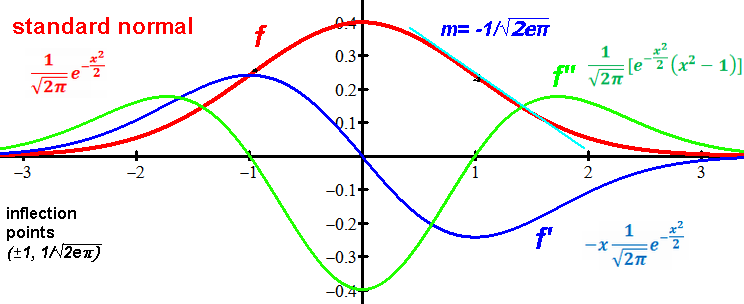
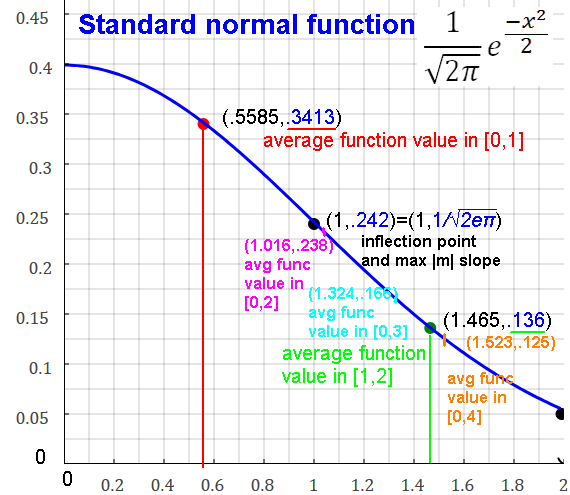
f(0)=1/√(2π) ≈.3989
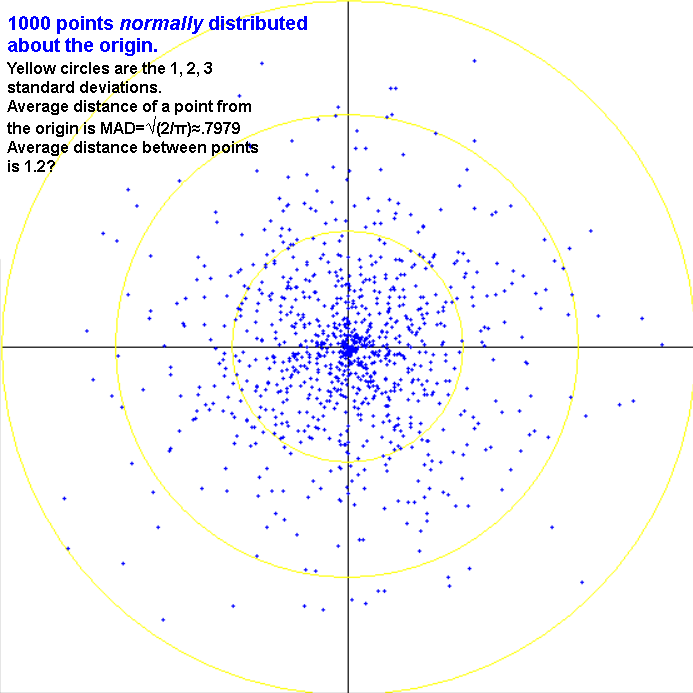
MAD = √(2/π) ≈ .798
Average difference between two data values randomly chosen from the
standard normal distribution is 2/√π ≈ 1.128 = MAD√2
σ=1/√2π=1/2.5066= .3989 → PDF(0)=1
 equivalently:
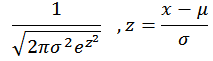
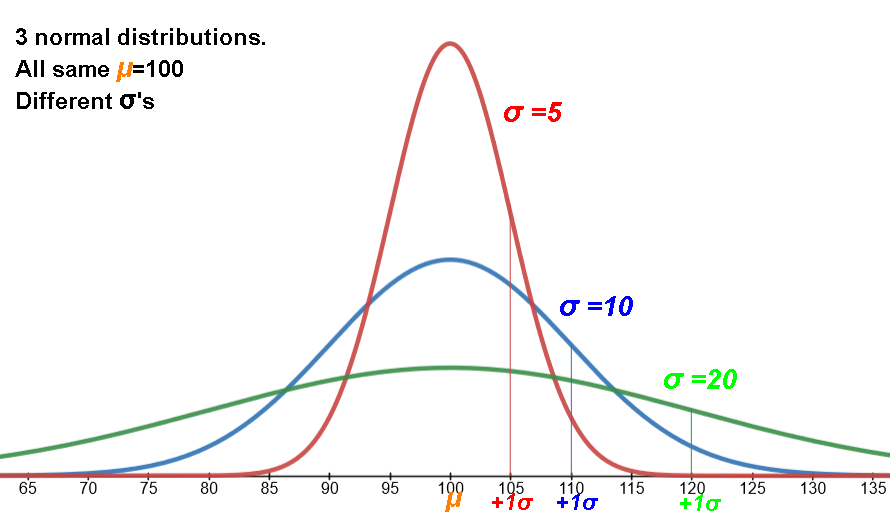
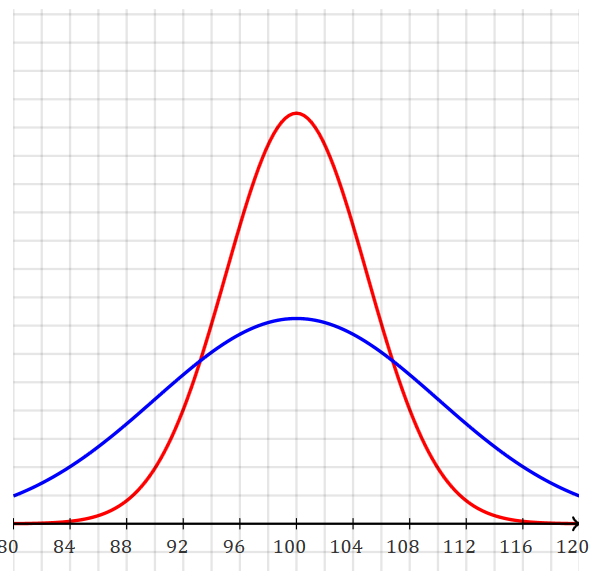
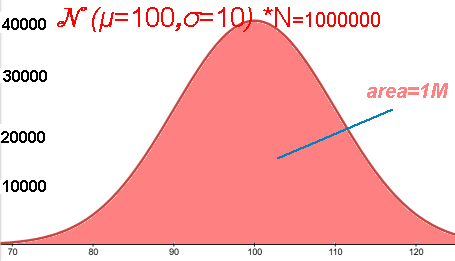
μ=100, blue σ=10, red σ=5
Mathpapa:
y=1/(10*sqrt(2*PI)) * e^(-(x-100)^2/(2*10^2))  ; y=1/(5*sqrt(2*PI)) * e^(-(x-100)^2/(2*5^2))
Xmin: 80  Xmax:120   Ymin:-.01   Ymax: .1

Desmos:
y=1/(10\sqrt{2\pi})\cdot e^{\frac{-\left(x-100\right)^{2}}{2\cdot10^{2}}}
X-axis: 80 to 120     Y-axis: 0 to .05

Any normal: Mathpapa
y=1/(s*sqrt(2*PI)) * e^(-(x-m)^2/(2*s^2))  @s=  ;m=
Desmos:
y=1/(s\cdot\sqrt{2\cdot\pi})\cdot e^{-\frac{\left(x-m\right)^{2}}{2s^{2}}}
Multiply by n or N.
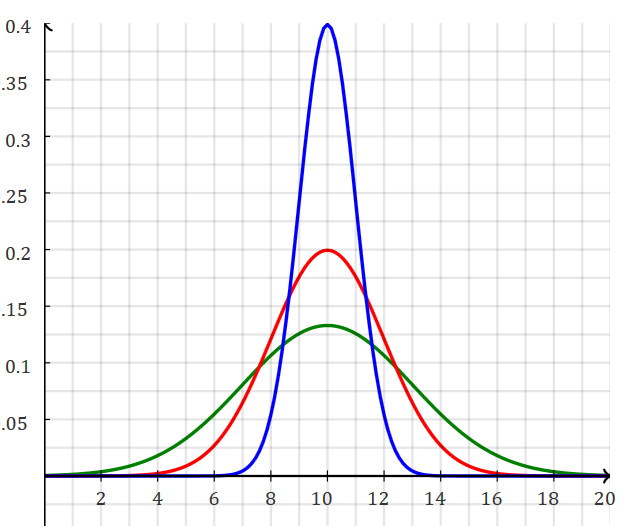
Mathpapa:
y=1/(1*sqrt(2*PI)) * e^(-(x-10)^2/(2*1^2))  ; y=1/(2*sqrt(2*PI)) * e^(-(x-10)^2/(2*2^2))  ; y=1/(3*sqrt(2*PI)) * e^(-(x-10)^2/(2*3^2))
Xmin: 0  Xmax:20   Ymin:-.1   Ymax: .4
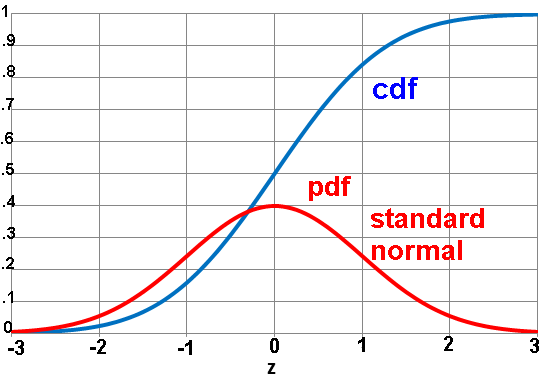
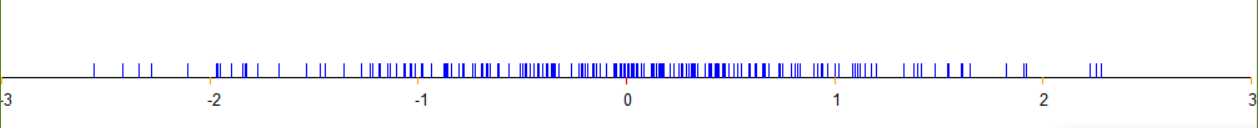
1-D standard normal distribution.
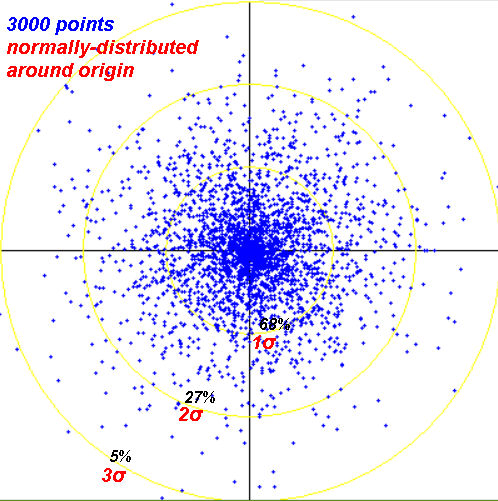
2-D normal distribution.
Average (or expected) difference between two data values randomly chosen from a normal distribution is 2σ/sqrt(pi) = 1.128σ = MAD√2
Two normal distributions (two independent normal RVs, W and Y).
Probability that a random from W is greater than a random from Y: RV D = W-Y is normal with
μd = μw - μy
σd = √[σ2w + σ2y]
P(W-Y>0) = P(D>0) → x = 0
Into above calculator to determine z and 1-CDF(z).
| z (#std devs) | y |
|---|---|
| 0=μ | 0.39894228 |
| 1 | 0.24197072 |
| 2 | 0.05399096 |
| 3 | 0.00443184 |
| 4 | 0.00013383 |
| 5 | 0.00000148 |
| 1σ | 2σ | 3σ | 4σ | 5σ | |
|---|---|---|---|---|---|
| 0=μ | 1.6 | 7.4 | 90 | 2981 | 268,337 |
| 1σ | 4.5 | 55 | 1808 | 162,755 | |
| 2σ | 12 | 403 | 36,315 | ||
| 3σ | 33 | 2981 | |||
| 4σ | 90 |
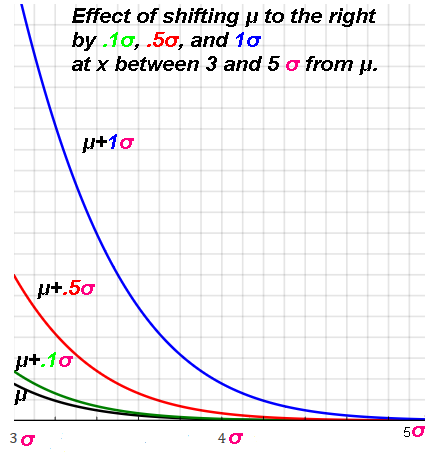
| at SD= | 1 | 2 | 3 | 4 | 5 | 6 |
|---|---|---|---|---|---|---|
| μ=0 (baseline) | 1 | 1 | 1 | 1 | 1 | 1 |
| μ=0.1 | 1.100 | 1.215 | 1.343 | 1.484 | 1.640 | 1.813 |
| μ=0.5 | 1.455 | 2.399 | 3.955 | 6.521 | 10.751 | 17.725 |
| μ=1.0 | 1.649 | 4.482 | 12.182 | 33.115 | 90.017 | 244.692 |
Ex. When the mean shifts .5 SD to the right, there will be 3.955 times as much/many
data at the original +3σ value as there was originally when μ was 0.
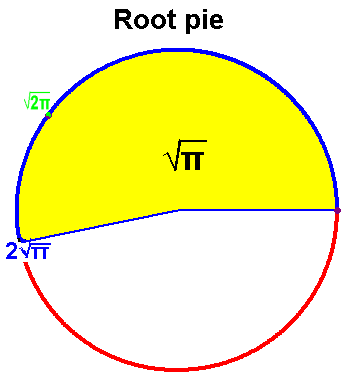
√(2π)≈2.507 √π≈1.772
Alternate definitions of what's standard.
Derivatives of standard normal function: